TalkLog
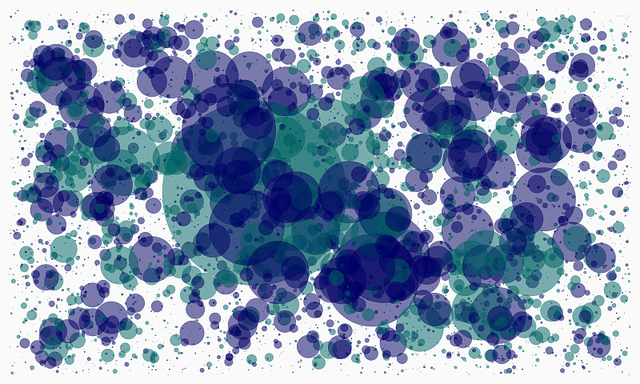
talkLog_01 is an interface to analyze phone-call activity over a period of time.
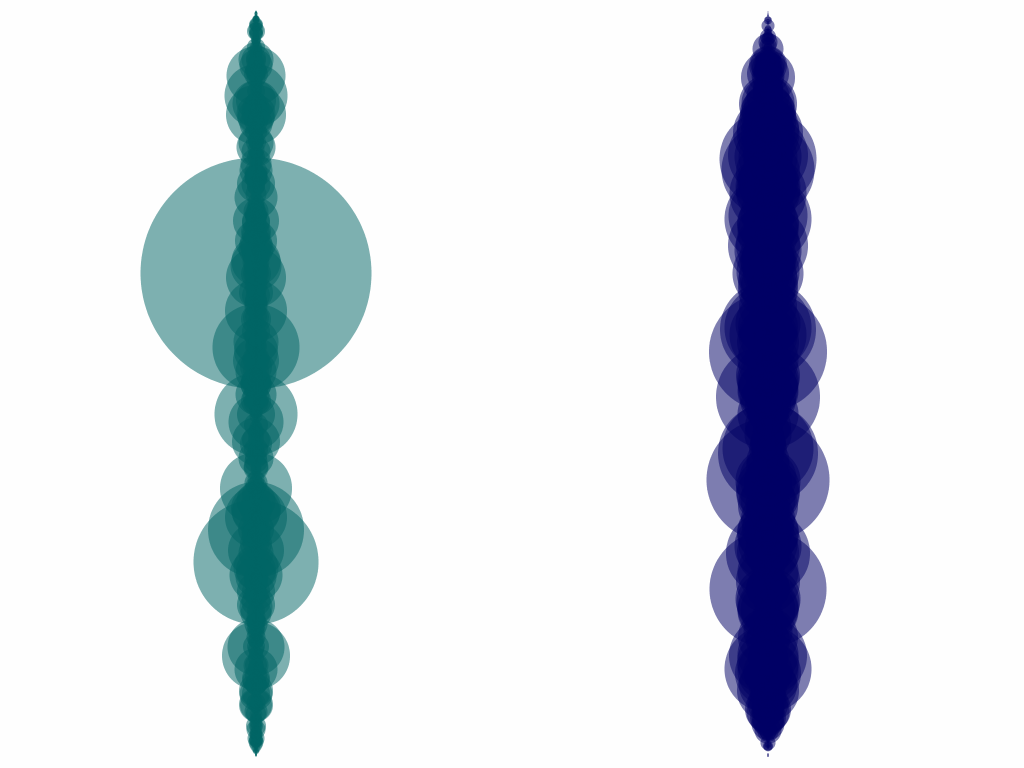
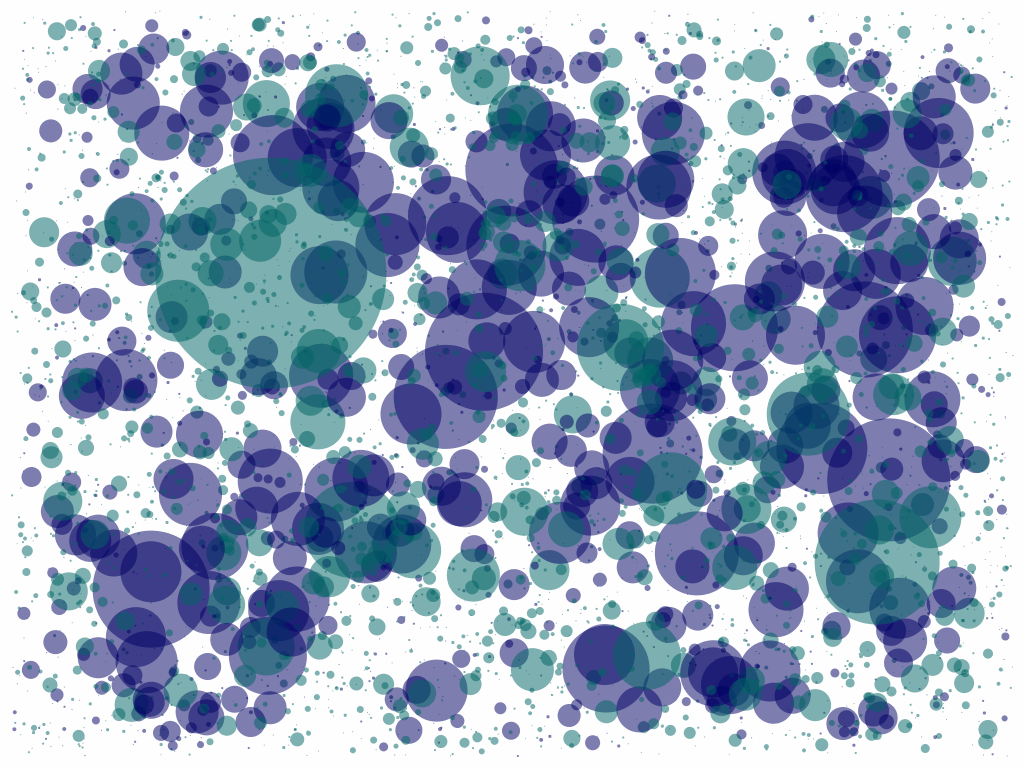
Each call is represented by a bubble. Green bubbles represent incoming calls, while purple bubbles depict outgoing calls. The size of each bubble conveys the duration of each call ― the bigger the bubble, the longer the call.
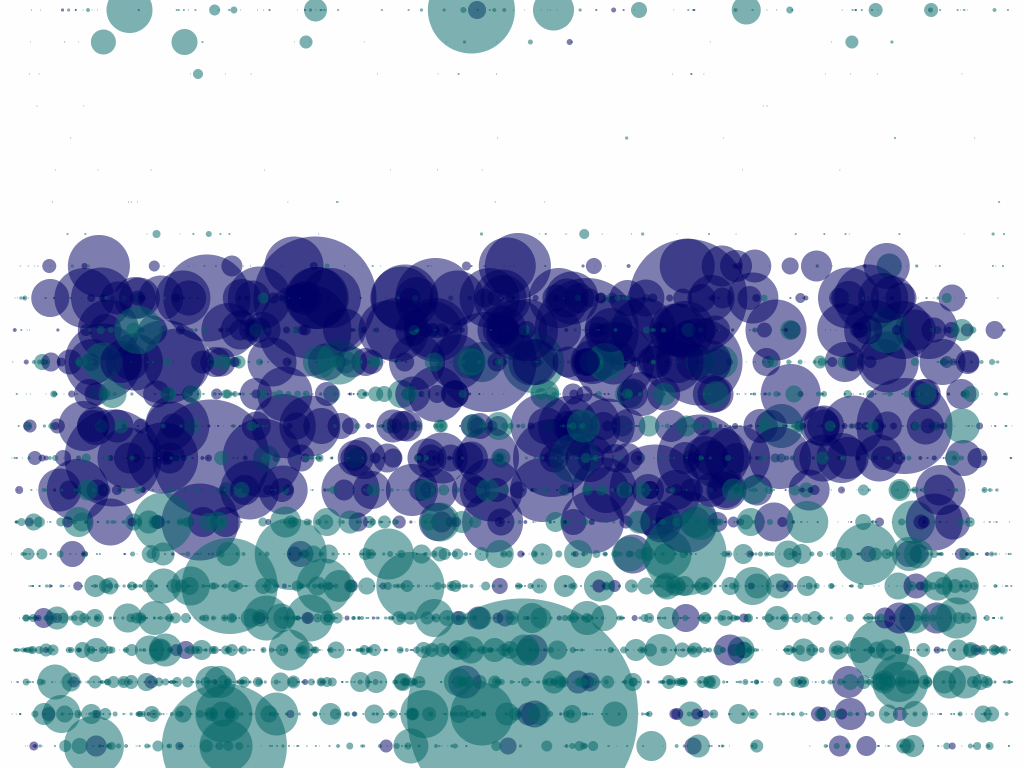
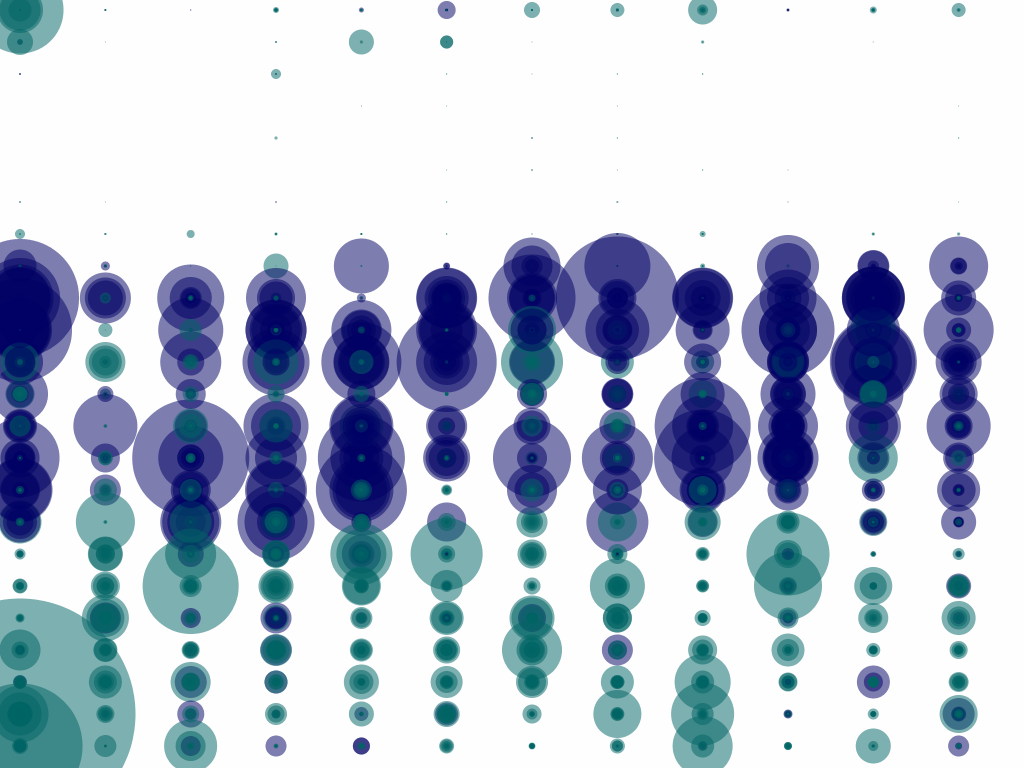
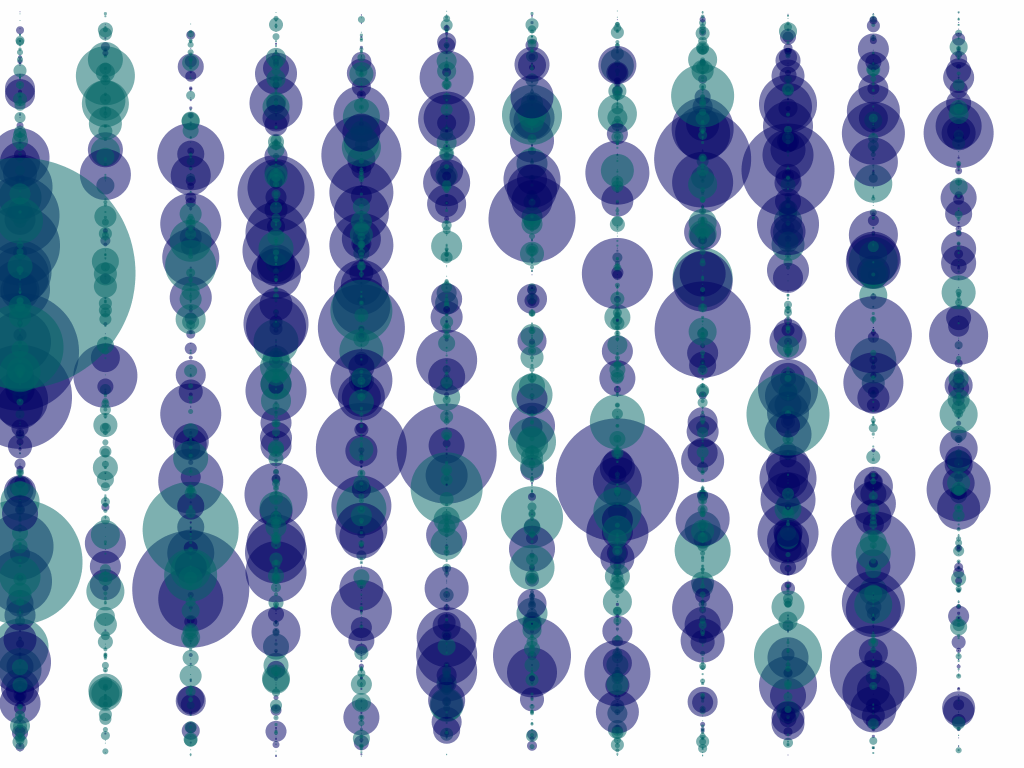
interaction The user has the ability to interact with the dataset by using the keyboard's arrow keys to toggle through different sorting modes. Each key applies a different sorting function to which the bubbles react by shifting their position in the screen representing a different facet of the data.
The different filter modes can map the bubble's x-axis based on the call's month or set the bubble's y-axis location to the call's time, from 0hrs to 23hrs. Also, the positions of the bubbles can be placed in two different columns; incoming and outgoing.
data+process The data is first downloaded from the carrier's website as a CSV file and loaded into the system. Once loaded, the data gets parsed and each record is turned into a bubble object which is rendered to the screen.