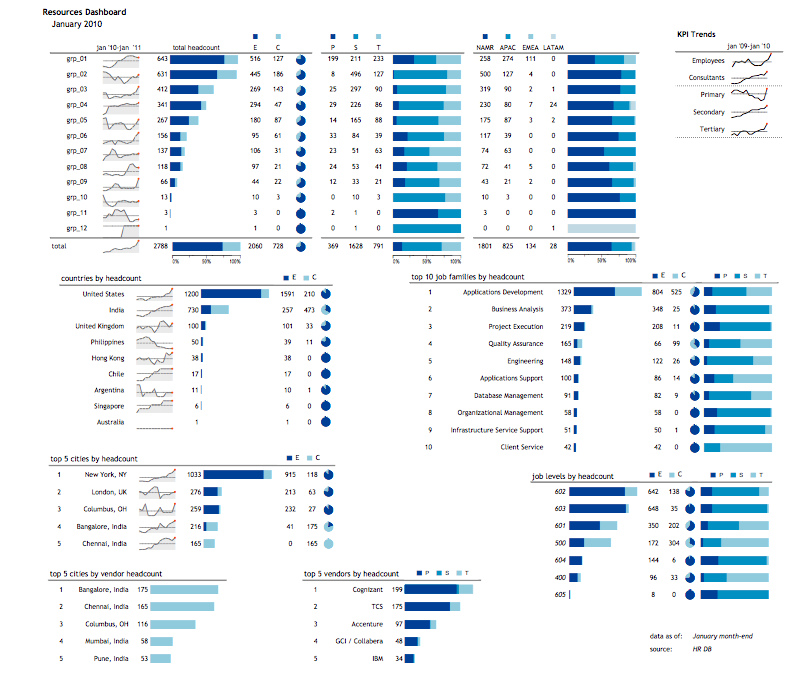
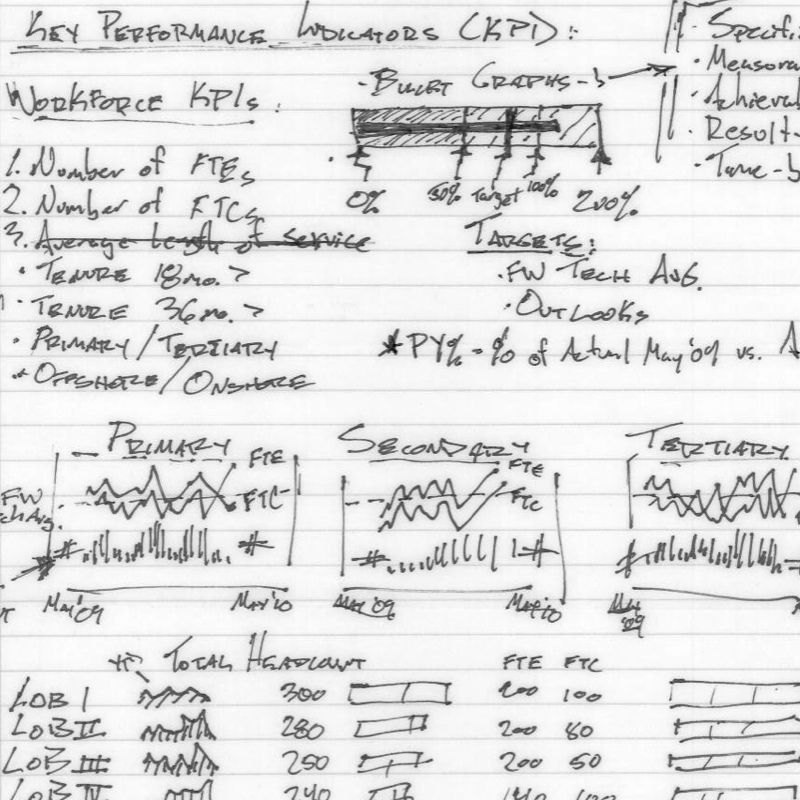
Resources Dashboard
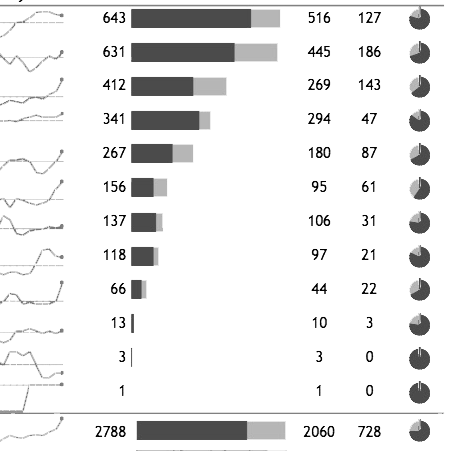
Resources_Dash is a one-pager employee headcount dashboard that logically binds demographic, job/role, and organizational structure metrics together.
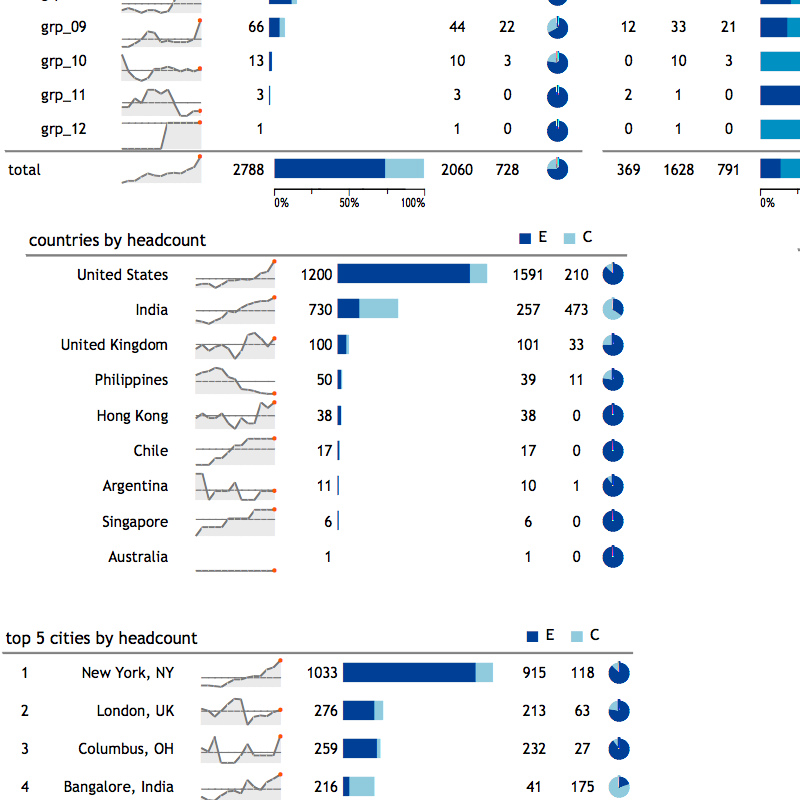
Nominal data such as business unit, country, city, or job function is stacked together to compare headcount and distribution by the use of horizontal stacked bar charts. Adjacent, a sparkline is used to represent year-to-date headcount. As introduced by Edward Tufte, sparklines represent high density data with a small graphic. By stacking them together, the repetition of sparklines creates small multiples, letting us compare and contrast different data facets.
data+process
The data is extracted from an Oracle database using Hyperion into a temporary Microsoft Access database where its validated, transformed and staged with Visual Basic for Applications (VBA) scripts. The data is then published to the target template tables in Excel where the graphics are rendered and output converted to PDF.